The State of Special Education: The Best U.S. States for Supporting Students
By: BlazerWorksAcross the country, millions of students rely on special education services, but the quality of support, access to resources, and family experience vary greatly depending on where they live. To understand which states are doing the most to help students with disabilities succeed, BlazerWorks analyzed data from education and health agencies nationwide to develop the State of Special Education Index, a comprehensive look at how well each state supports students with special needs.
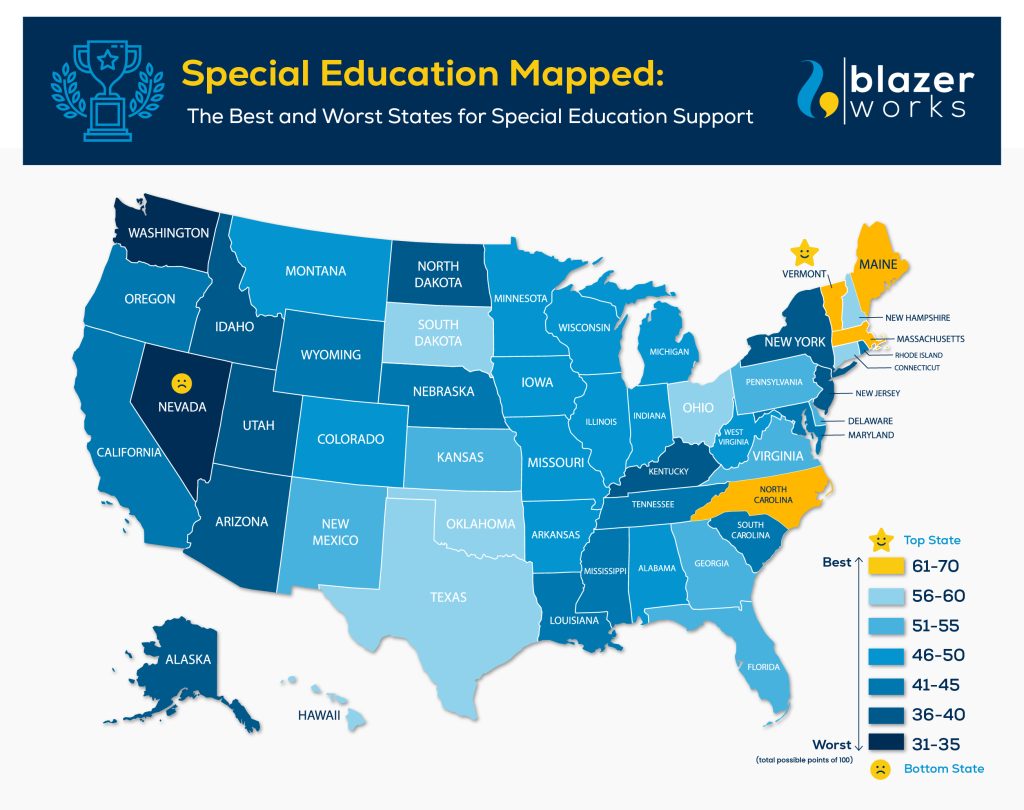
The results highlight both encouraging progress and areas still in need of improvement. While states like Vermont, North Carolina, and Maine stand out for inclusive programming and strong student outcomes, the data shows that many states still face challenges in providing equitable access to early intervention, therapy services, and individualized education plans (IEPs).
Measuring Special Education Support, Quality, and Outcomes
The State of Special Education Index evaluates how effectively states serve students with disabilities and related learning or developmental conditions. Each state was scored across ten equally weighted factors that measure the strength of student support systems, staff infrastructure, academic and social outcomes, and family satisfaction. Data were sourced from nationally recognized organizations, including the U.S. Department of Education, the U.S. Department of Labor, and the Health Resources and Services Administration, reflecting the most recent findings.
Key Indicators included:
-
Student support services spending and staffing levels
-
Graduation rates for students with disabilities
-
Early intervention plan access
-
Therapy availability and quality
-
Academic success and peer relationships
-
Parent satisfaction with care coordination
Together, these factors offer a holistic view of how each state is supporting the social, emotional, and academic development of students with special needs.
Key Findings: The Top 5 States for Special Education
-
Vermont — Vermont ranks #1 nationally for special education, excelling across nearly every category of support and inclusion. The state dedicates a substantial 8.01% of public school spending to student support services—the seventh highest in the nation—and employs the country’s fifth largest ratio of support staff (10.84% of total school personnel).
- Extracurricular Inclusion: 78.8% of children with special needs participate in organized activities (4th nationally).
- Peer Relationships: 53.4% of children with learning disabilities or developmental conditions report no difficulty maintaining friendships (5th).
- Academic Success: 40.2% of students with developmental or learning conditions earn mostly A’s and B’s (9th).
- Early Intervention Plans: 50.5% of children with conditions—including ADHD, anxiety, autism spectrum disorder (ASD), and learning disabilities—receive special education or early intervention support in school (9th).
-
North Carolina — North Carolina ranks #2 overall for its high rates of individualized education plans (IEPs) and future workforce readiness. The state provides early educational support to 52.6% of students with learning or developmental challenges, ranking fourth nationally, and is among the top states for special education teacher employment growth (+6.9%), suggesting strong future capacity to meet rising student needs.
- Therapy Access: 34.5% of students with special needs receive the speech, occupational, or physical therapy they need (12th).
- Extracurricular Inclusion: 73.3% of children with special needs involved in activities outside of class (13th).
- Peer Relationships: 51.3% of students with mental, emotional, developmental, or behavioral conditions report ease in making or keeping friends (16th).
-
Maine — Maine ranks #3 nationwide, performing exceptionally well in staffing, therapy services, and academic outcomes. The state employs the third-highest proportions of student support staff in the U.S. (12.06%), ensuring that critical professionals such as school psychologists, social workers, and speech pathologists are accessible to students.
- Therapy Access: 37.1% of students with special needs receive necessary therapies (5th).
- Academic Success: 41.4% of students with developmental or learning conditions earn mostly A’s and B’s (6th).
- Early Intervention: 50.5% of students with developmental or learning challenges receive the special education or intervention plans they need (9th).
- Extracurricular Inclusion: 74.3% of children with special needs participate in extracurricular activities alongside peers (11th).
- Graduation Rate: 73% of students with disabilities complete high school (15th).
-
Massachusetts — Massachusetts ranks #4, reflecting its long-standing reputation for excellence in public education paired with strong special education infrastructure. The state dedicates 8.05% of total public education funds to student support services (6th nationally) and maintains one of the highest graduation rates for students with disabilities (78%).
- Therapy Access: 36.8% of students with conditions such as ADHD, anxiety, autism spectrum disorder (ASD), and other learning disabilities receive therapies that meet developmental needs (6th).
- Academic Success: 40.4% of students with developmental or learning conditions achieve mostly A’s and B’s (9th).
- Employment Outlook: Special education teacher employment projected to grow by 8.8% through 2032.
- Peer Relationships: 51.8% of students with learning disabilities or developmental conditions report no difficulty maintaining friendships (12th).
-
Texas — Texas rounds out the top five with exceptional academic and graduation outcomes for students with special needs. It ranks 1st in the nation for academic performance, with 47.7% of students with mental, emotional, developmental, or behavioral conditions earning mostly A’s and B’s, and maintains a 79.1% graduation rate—the sixth highest nationally.
- Employment Growth: Special education teacher employment projected to rise 11.5%, ensuring long-term program strength.
- Peer Relationships: 52.8% of students with developmental or learning conditions report ease in making and maintaining friendships (7th).
- Early Intervention: Nearly half (49.2%) of students with learning conditions receive tailored education plans (13th).
Special Education Mapped: How States Compare
| Rank | State | Total Score |
|---|---|---|
| 1 | Vermont | 69.69 |
| 2 | North Carolina | 62.87 |
| 3 | Maine | 62.80 |
| 4 | Massachusetts | 62.16 |
| 5 | Texas | 58.87 |
| 6 | Oklahoma | 58.66 |
| 7 | Ohio | 58.48 |
| 8 | Connecticut | 58.28 |
| 9 | New Hampshire | 57.86 |
| 10 | South Dakota | 56.69 |
| 11 | Hawaii | 56.32 |
| 12 | Delaware | 54.94 |
| 13 | Pennsylvania | 54.91 |
| 14 | Georgia | 54.61 |
| 15 | Virginia | 54.02 |
| 16 | Kansas | 53.57 |
| 17 | New Mexico | 53.21 |
| 18 | Florida | 53.21 |
| 19 | Colorado | 50.46 |
| 20 | Arkansas | 50.31 |
| 21 | Illinois | 50.26 |
| 22 | West Virginia | 50.19 |
| 23 | Alabama | 50.12 |
| 24 | Montana | 49.96 |
| 25 | Michigan | 49.58 |
| 26 | Minnesota | 49.48 |
| 27 | Indiana | 48.73 |
| 28 | Missouri | 48.20 |
| 29 | Wisconsin | 47.03 |
| 30 | Iowa | 46.11 |
| 31 | South Carolina | 45.08 |
| 32 | Nebraska | 44.84 |
| 33 | Wyoming | 44.24 |
| 34 | Oregon | 44.21 |
| 35 | California | 43.79 |
| 36 | Louisiana | 43.43 |
| 37 | Tennessee | 42.31 |
| 38 | Rhode Island | 41.82 |
| 39 | Mississippi | 41.70 |
| 40 | Maryland | 41.06 |
| 41 | Kentucky | 40.78 |
| 42 | Arizona | 40.73 |
| 43 | North Dakota | 40.73 |
| 44 | Utah | 40.58 |
| 45 | New York | 40.36 |
| 46 | New Jersey | 39.09 |
| 47 | Alaska | 38.44 |
| 48 | Idaho | 37.78 |
| 49 | Washington | 33.12 |
| 50 | Nevada | 30.54 |
Supporting Every Learner
The State of Special Education Index highlights that meaningful progress is happening. States like Vermont, North Carolina, and Maine are setting the bar for inclusion and quality care, while others are working to build stronger foundations.
When students with disabilities receive the right combination of tools—like early intervention, academic flexibility, and access to emotional and developmental support—they have the ability to thrive both inside the classroom and beyond their academic years. The data shows that states with specialized staff and integrated health services see higher grades, better graduation rates, and greater family satisfaction.
At BlazerWorks, we believe every student deserves to reach their full potential. We’re proud to partner with schools across the country to close these gaps, helping educators and districts deliver exceptional support for students with diverse learning needs. Discover how we empower schools with the specialized professionals and resources that help every student reach their full potential here, and explore our additional resources on special education insights.